Multiple Choice
Use the following figure to answer the question : Figure 18-2 :
shows the demand and supply curves of labor.A per-unit tax imposed on the wage income of the employees shifts the supply curve of labor upward. 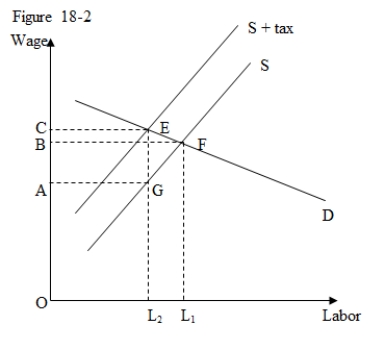
-According to Figure 18-2,the proportion of the per-unit tax paid by employees is:
A) CB/CA.
B) BA/OB.
C) AB/CA.
D) OA/OC.
Correct Answer:

Verified
Correct Answer:
Verified
Q34: Which of the following is a major
Q35: Which of the following best describes wage
Q36: Most of a payroll tax is eventually
Q37: Using a graph,explain the employment effects of
Q38: Which of the following defines an efficiency
Q40: Identify some of the reasons due to
Q41: Use the following figure to answer the
Q42: Employers sometimes reduce the fringe benefits provided
Q43: Which of the following factors determines the
Q44: Provide a self-interested explanation for why labor