Multiple Choice
Exhibit 12-5
The table below gives beverage preferences for random samples of teens and adults. 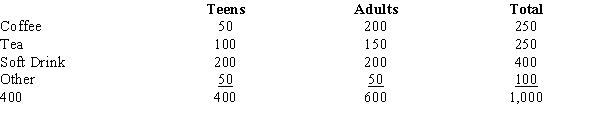 We are asked to test for independence between age (i.e., adult and teen) and drink preferences.
-Refer to Exhibit 12-5. The expected number of adults who prefer coffee is
A) 0.25
B) 0.33
C) 150
D) 200
Correct Answer:

Verified
Correct Answer:
Verified
Q66: Exhibit 12-7<br>You want to test whether or
Q67: Exhibit 12-1<br>When individuals in a sample of
Q68: Exhibit 12-3<br>In order to determine whether or
Q69: Before the presidential debates, it was
Q70: Exhibit 12-4<br>In the past, 35% of the
Q72: Use <span class="ql-formula" data-value="\alpha"><span class="katex"><span
Q73: A lottery is conducted that involves the
Q74: Exhibit 12-7<br>You want to test whether or
Q75: A manager believes that the shelf life
Q76: Prior to the start of the season,