Essay
Figure 18-4 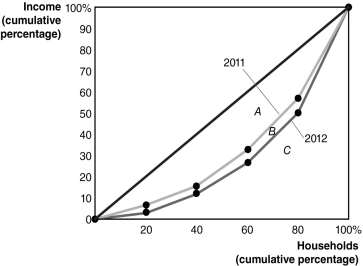
-Refer to Figure 18-4 to answer the following questions.
a.Did the distribution of income become more equal in 2012 than it was in 2011,or did it become less equal? Explain.
b.If area A = 1,900,area B = 450,and area C = 2,650,calculate the Gini coefficient for 2011 and the Gini coefficient for 2012.
Correct Answer:

Verified
a.The distribution of income became less...View Answer
Unlock this answer now
Get Access to more Verified Answers free of charge
Correct Answer:
Verified
View Answer
Unlock this answer now
Get Access to more Verified Answers free of charge
Q28: A tax on interest earned from saving
Q30: A government-imposed tax on soft drinks would
Q34: Table 18-5<br> <img src="https://d2lvgg3v3hfg70.cloudfront.net/TB4186/.jpg" alt="Table 18-5
Q36: Table 18-7<br> <img src="https://d2lvgg3v3hfg70.cloudfront.net/TB4186/.jpg" alt="Table 18-7
Q37: Table 18-4<br> <img src="https://d2lvgg3v3hfg70.cloudfront.net/TB4186/.jpg" alt="Table 18-4
Q92: The Arrow impossibility theorem<br>A)explains why people can
Q145: The excess burden of a tax<br>A)measures the
Q154: The average tax rate is calculated as<br>A)total
Q191: What is the difference between the poverty
Q236: In the United States, the federal income