Multiple Choice
Figure 13-3 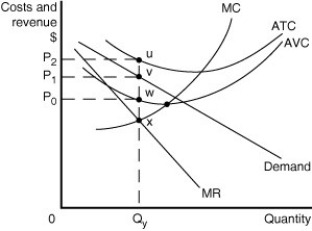 Figure 13-3 shows short-run cost and demand curves for a monopolistically competitive firm in the footwear market.
-Refer to Figure 13-3.Which of the following is the area that represents the profit or loss experienced by the firm?
A) A loss represented by the rectangle P2uvP1.
B) A loss represented by the rectangle P2uwP0.
C) A loss represented by the rectangle P1vwP0.
D) An accounting profit equal to P1vwP0.
Correct Answer:

Verified
Correct Answer:
Verified
Q36: When a monopolistically competitive firm lowers it
Q56: Which of the following would not occur
Q62: Table 13-1<br> <img src="https://d2lvgg3v3hfg70.cloudfront.net/TB4186/.jpg" alt="Table 13-1
Q63: Table 13-2<br> <img src="https://d2lvgg3v3hfg70.cloudfront.net/TB4186/.jpg" alt="Table 13-2
Q65: Figure 13-5 <img src="https://d2lvgg3v3hfg70.cloudfront.net/TB4186/.jpg" alt="Figure 13-5
Q66: Figure 13-4 <img src="https://d2lvgg3v3hfg70.cloudfront.net/TB4186/.jpg" alt="Figure 13-4
Q130: The economic analysis of monopolistic competition shows
Q145: If firms in a monopolistically competitive industry
Q179: In San Francisco there are many restaurants
Q252: A monopolistically competitive firm that is profitable