Multiple Choice
Figure 13-4 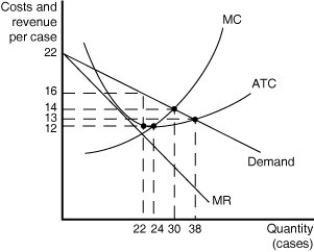 Figure 13-4 shows cost and demand curves for a monopolistically competitive producer of iced-tea.
-Refer to Figure 13-4.What is the profit-maximizing output level?
A) 22 cases
B) 24 cases
C) 30 cases
D) 38 cases
Correct Answer:

Verified
Correct Answer:
Verified
Q36: When a monopolistically competitive firm lowers it
Q56: Which of the following would not occur
Q62: Table 13-1<br> <img src="https://d2lvgg3v3hfg70.cloudfront.net/TB4186/.jpg" alt="Table 13-1
Q63: Table 13-2<br> <img src="https://d2lvgg3v3hfg70.cloudfront.net/TB4186/.jpg" alt="Table 13-2
Q65: Figure 13-5 <img src="https://d2lvgg3v3hfg70.cloudfront.net/TB4186/.jpg" alt="Figure 13-5
Q67: Figure 13-3 <img src="https://d2lvgg3v3hfg70.cloudfront.net/TB4186/.jpg" alt="Figure 13-3
Q114: Explain the similarities and differences between the
Q130: The economic analysis of monopolistic competition shows
Q145: If firms in a monopolistically competitive industry
Q252: A monopolistically competitive firm that is profitable