Multiple Choice
Figure 13-9 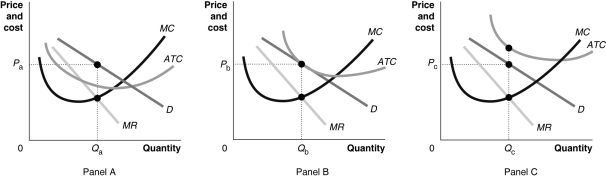
-Refer to Figure 13-9.Which of the graphs in the figure above reflects the decline in sales that Starbucks experienced as a result of increased competition from companies like McDonald's and Dunkin' Donuts.Assume that as a result of the competition,Starbucks began to experience an economic loss.
A) Panel A
B) Panel B
C) Panel C
D) either Panel A or Panel C
Correct Answer:

Verified
Correct Answer:
Verified
Q16: One reason Starbucks experienced a decline in
Q33: Monopolistically competitive firms face a perfectly elastic
Q79: What effect does the entry of new
Q112: Some factors that allow firms to make
Q146: _ describes the actions a firm takes
Q153: Only one of the following statements is
Q185: A profit-maximizing monopolistically competitive firm produces and
Q205: A monopolistic competitor does not earn profits
Q254: A monopolistically competitive firm maximizes profit in
Q263: For a downward-sloping demand curve, marginal revenue