Multiple Choice
The figure below shows the short-run aggregate supply curve of an economy.If the actual price level exceeds the expected price level,then:
Figure 10.1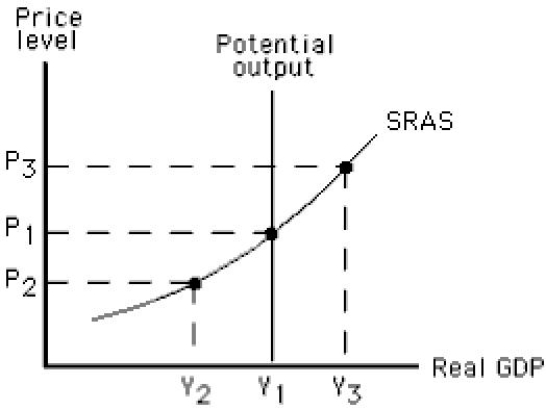
A) equilibrium output is likely to be Y2 in the short run.
B) equilibrium output is likely to be Y1 in the short run.
C) equilibrium output is likely to be Y3 in the short run.
D) potential output is greater than actual output.
E) unemployment is above the natural rate.
Correct Answer:

Verified
Correct Answer:
Verified
Q18: The potential output of an economy is:<br>A)the
Q45: Suppose the real wage remains unchanged between
Q51: When the economy is at its potential
Q58: Which of the following is most likely
Q72: Which of the following is true in
Q92: Which of the following is true of
Q106: An increase in aggregate demand in the
Q132: Which of the following is true of
Q139: The figure below shows the short-run aggregate
Q149: Which of the following supply shocks will