Multiple Choice
The figure below shows the short-run aggregate demand and supply curves of an economy.If the economy is currently producing at Y2,long-run equilibrium will most likely be established by a(n) :
Figure 10.2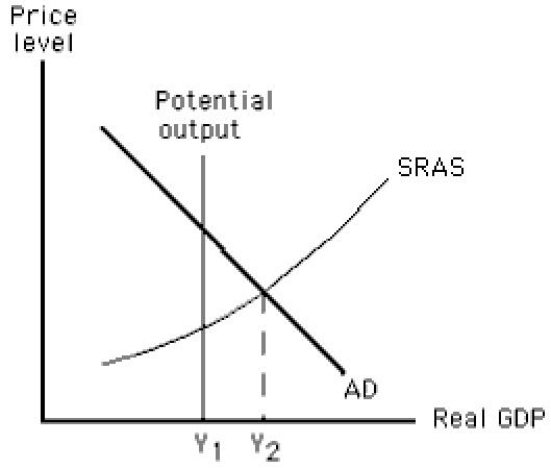
A) increase in short-run aggregate supply.
B) decrease in short-run aggregate supply.
C) decrease in potential output.
D) increase in potential output.
E) rightward shift of the aggregate demand curve.
Correct Answer:

Verified
Correct Answer:
Verified
Q18: The potential output of an economy is:<br>A)the
Q23: Which of these is not a beneficial
Q45: Suppose the real wage remains unchanged between
Q72: Which of the following is true in
Q92: Which of the following is true of
Q132: Which of the following is true of
Q134: The short-run equilibrium output in the economy
Q135: The figure given below depicts long-run equilibrium
Q137: In the figure given below,when aggregate supply
Q143: The figure below shows the short-run aggregate