Multiple Choice
The figure below shows the short-run aggregate supply curve of an economy.In this figure,a recessionary gap would be represented by the distance between:
Figure 10.1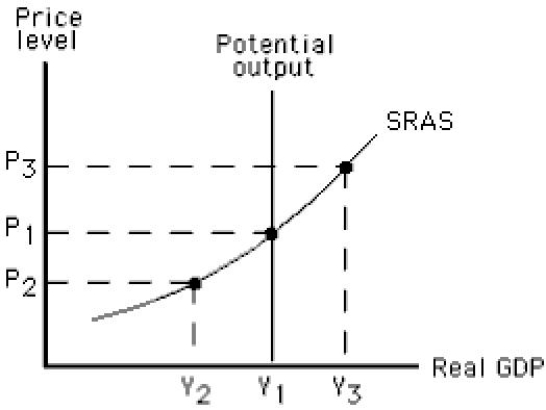
A) Y1and Y2.
B) Y1and Y3.
C) Y2and Y3.
D) P3and P1.
E) P3and P2.
Correct Answer:

Verified
Correct Answer:
Verified
Q12: Potential output depends on all of the
Q29: Suppose an economy is initially in long-run
Q55: Stagflation is defined as:<br>A)decreased output accompanied by
Q70: Which of the following is true of
Q91: A recessionary gap develops:<br>A)when actual output exceeds
Q95: Consider schedule #1 in the aggregate demand
Q104: The figure below shows equilibrium in an
Q110: Which of these changes is observed in
Q140: A failure in coordination between workers and
Q148: An expansionary gap generally creates inflationary pressure