Multiple Choice
The figure below shows equilibrium in an aggregate demand-aggregate supply model.The shift from AS to AS' in this figure represents a(n) :
Figure 10.3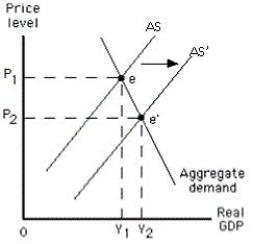
A) increase in short-run aggregate supply.
B) increase in long-run aggregate supply.
C) decrease in short-run aggregate supply.
D) decrease in long-run aggregate supply.
E) decrease in the aggregate quantity demanded.
Correct Answer:

Verified
Correct Answer:
Verified
Q12: Potential output depends on all of the
Q36: Which of these is an advantage of
Q55: Stagflation is defined as:<br>A)decreased output accompanied by
Q70: Which of the following is true of
Q89: In the long run,an economy will produce
Q91: A recessionary gap develops:<br>A)when actual output exceeds
Q96: Given a downward-sloping aggregate demand curve,if short-run
Q99: The figure below shows the short-run aggregate
Q109: The figure below shows the short-run aggregate
Q116: If resource prices are "sticky" downward and