Multiple Choice
The figure below shows equilibrium in an aggregate demand-aggregate supply model.Which of these statements is true if the economy described by this figure is at point M on SRAS100?
Figure 10.4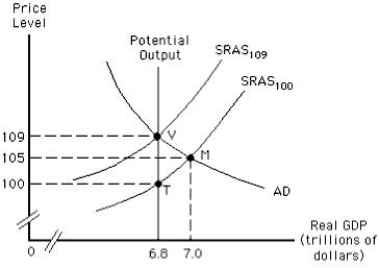
A) The actual price level is lower than expected with a $200 billion expansionary gap.
B) The actual price level is lower than expected with a $200 billion recessionary gap.
C) The actual price level is higher than expected with a $200 billion recessionary gap.
D) The actual price level is higher than expected with a $200 billion expansionary gap.
E) The economy is in equilibrium in the short run and the long run.
Correct Answer:

Verified
Correct Answer:
Verified
Q22: Which of the following occurs when an
Q36: Which of these is an advantage of
Q40: Wage rates are typically flexible upward but
Q68: Which of the following types of unemployment
Q74: The amount by which actual output falls
Q80: Which of the following is true if
Q96: Given a downward-sloping aggregate demand curve,if short-run
Q101: If nominal wage rates increase by 2
Q109: The figure below shows the short-run aggregate
Q118: If the expected price level exceeds the