Multiple Choice
The figure below shows the short-run aggregate demand and supply curves of an economy.In this figure,the distance between Y1 and Y2 represents:
Figure 10.2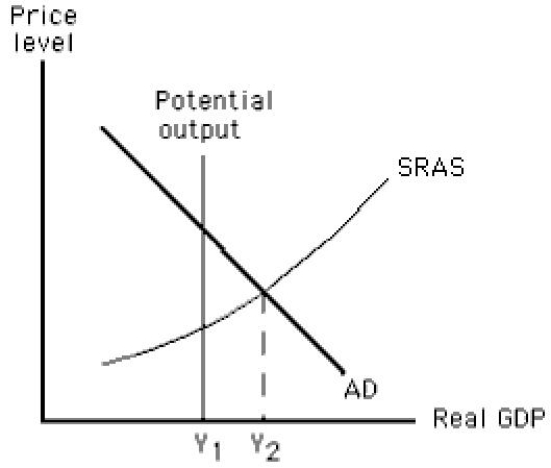
A) an expansionary gap.
B) a recessionary gap.
C) a cost-push inflation.
D) the natural rate of unemployment.
E) the full employment output.
Correct Answer:

Verified
Correct Answer:
Verified
Q36: Which of these is an advantage of
Q40: Wage rates are typically flexible upward but
Q74: The amount by which actual output falls
Q80: Which of the following is true if
Q89: In the long run,an economy will produce
Q96: Given a downward-sloping aggregate demand curve,if short-run
Q101: If nominal wage rates increase by 2
Q104: The figure below shows equilibrium in an
Q112: The figure below shows equilibrium in an
Q116: If resource prices are "sticky" downward and