Multiple Choice
The figure below shows the equilibrium in an aggregate demand-aggregate supply model.In this figure,which of the following is true for an economy that is at point V in the short run?
Figure 10.4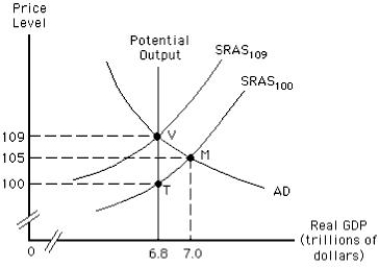
A) There is a recessionary gap worth $200 billion.
B) The potential output is $7 trillion.
C) The actual price level is 100.
D) The natural rate of unemployment is more than 6.8 trillion.
E) The actual output is equal to the potential output.
Correct Answer:

Verified
Correct Answer:
Verified
Q2: In the aggregate demand-aggregate supply model,which of
Q6: Which of the following is true?<br>A)The nominal
Q42: In the long run,a decrease in aggregate
Q45: The figure below shows the determination of
Q52: The fact that some resource prices are
Q62: Which of these does not hold true
Q73: The potential output of an economy is
Q94: The short-run aggregate supply curve shows a(n):<br>A)direct
Q131: Which of these is most likely to
Q137: Which of these is true of the