Multiple Choice
The figure below shows the determination of the equilibrium price level and real GDP in an aggregate demand-aggregate supply model.If the economy is at point H,there is a(n) :
Figure 10.7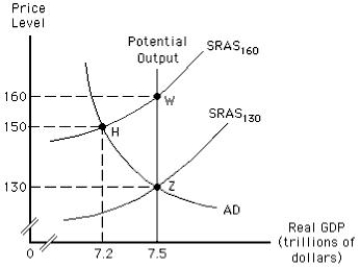
A) expansionary gap of $300 billion.
B) recessionary gap of $300 billion.
C) recessionary gap of $10 billion.
D) expansionary gap of $20 billion.
E) expansionary gap of $10 billion.
Correct Answer:

Verified
Correct Answer:
Verified
Q2: In the aggregate demand-aggregate supply model,which of
Q24: Which of the following is most likely
Q41: The figure given below depicts long run
Q42: The figure given below depicts long-run equilibrium
Q42: In the long run,a decrease in aggregate
Q44: The figure below shows the short-run aggregate
Q50: The figure below shows the equilibrium in
Q52: The fact that some resource prices are
Q73: The potential output of an economy is
Q133: Actual output can exceed the economy's potential