Multiple Choice
The figure given below depicts long-run equilibrium in the aggregate demand-aggregate supply model.Which of the following changes is depicted by the movement from Y1 to Y2?
Figure 10.9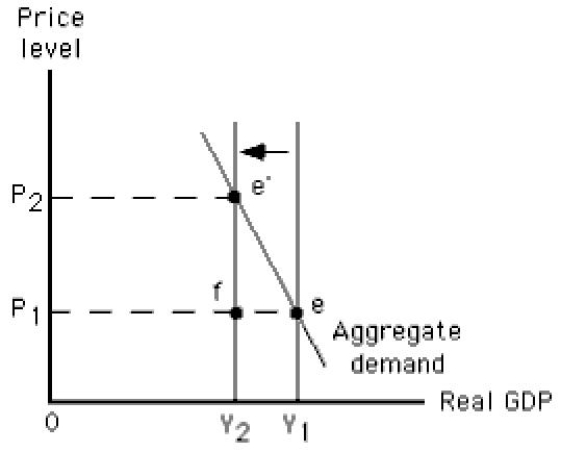
A) An increase in long-run aggregate supply
B) An increase in short-run aggregate supply
C) A decrease in short-run aggregate supply
D) A decrease in long-run aggregate supply
E) An increase in the aggregate quantity demanded
Correct Answer:

Verified
Correct Answer:
Verified
Q10: A nominal wage is:<br>A)always equal to the
Q14: The short run is a period of
Q23: Which of these is not a beneficial
Q38: The slope of the short-run aggregate supply
Q45: Suppose the real wage remains unchanged between
Q66: Suppose the real wage of a worker
Q92: Which of the following is true of
Q134: The short-run equilibrium output in the economy
Q137: In the figure given below,when aggregate supply
Q139: The figure below shows the short-run aggregate