Multiple Choice
The figure given below shows equilibrium in a money market.Which of the following will be observed if the money supply curve shifts from S to S' while the rate of interest remains at "r"? Figure 15.2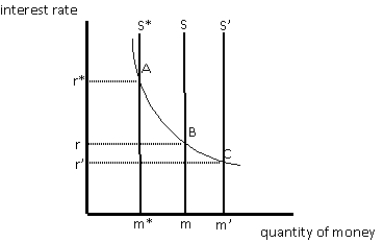
A) There will be an excess demand for money.
B) There will be an excess supply of money.
C) The Fed will buy U.S.Treasury securities.
D) The quantity of money demanded will fall.
E) The quantity of money supplied will fall.
Correct Answer:

Verified
Correct Answer:
Verified
Q9: Planned investment expenditures will eventually decrease after:<br>A)the
Q9: The figure given below shows the aggregate
Q14: If the value of the spending multiplier
Q24: The demand for money will be high
Q26: In the long run,an increase in aggregate
Q27: An increase in the nominal interest rate,other
Q41: Which of the following changes is most
Q96: In an economy in which real output
Q112: A decrease in the money supply in
Q129: Which of the following is not assumed