Multiple Choice
The figure given below shows the aggregate demand curve and the short-run aggregate supply curve of an economy.In this figure,short-run equilibrium occurs at: Figure 15.4
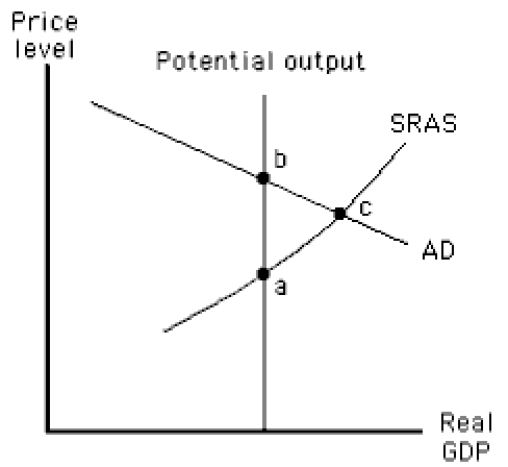
A) point b,where actual output exceeds potential output.
B) point a,where actual output exceeds potential output.
C) point c,where actual price level exceeds the expected price level.
D) point c,where the actual price level is less than the expected price level.
E) point b,where the actual price level exceeds the expected price level.
Correct Answer:

Verified
Correct Answer:
Verified
Q8: The figure given below shows equilibrium in
Q9: Planned investment expenditures will eventually decrease after:<br>A)the
Q24: The demand for money will be high
Q26: In the long run,an increase in aggregate
Q27: An increase in the nominal interest rate,other
Q41: Which of the following changes is most
Q43: The equilibrium interest rate in a money
Q96: In an economy in which real output
Q112: A decrease in the money supply in
Q129: Which of the following is not assumed