Multiple Choice
In the graph below,the area between the lines AC and OB to the right of point E represents ________. 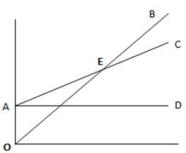
A) fixed costs
B) breakeven point
C) operating loss
D) operating income
Correct Answer:

Verified
Correct Answer:
Verified
Q285: Mackenzie,Inc.has collected the following data.(There are
Q286: Carrabelle Company has provided the following
Q287: In variable costing,fixed manufacturing overhead is considered
Q288: Asher Company sells two products-X and Y.Product
Q289: Last year,Adara Company produced 7000 units
Q290: Which of the following formulas is the
Q291: A contribution margin income statement classifies costs
Q292: The fixed manufacturing overhead is considered a
Q293: Resolute Company sells two generators-Model A and
Q294: Higher fixed costs decrease the total contribution