Multiple Choice
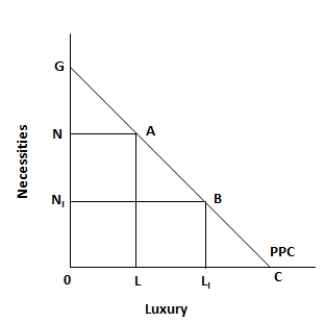
Figure 5.1. The figure shows a linear production possibility curve representing a tradeoff faced by a country, between necessities and luxuries. 
-Refer to figure 5.1. A fall in the gross domestic product of the country will lead to:
A) a leftward shift in the production possibility curve.
B) a rightward shift in the production possibility curve.
C) an increase in the consumption of luxury goods.
D) an upward movement along the production possibility curve.
E) no change in the consumption pattern of the country.
Correct Answer:

Verified
Correct Answer:
Verified
Q7: Figure 5.1. The figure shows a linear
Q8: Figure 5.2. The figure shows the supply
Q9: Figure 5.2. The figure shows the supply
Q10: Figure 5.1. The figure shows a linear
Q11: Figure 5.3. The figure shows the wage
Q13: Figure 5.2. The figure shows the supply
Q14: Figure 5.1. The figure shows a linear
Q15: Figure 5.2. The figure shows the supply
Q16: Figure 5.3. The figure shows the wage
Q17: Figure 5.2. The figure shows the supply