Multiple Choice
Figure 5.2. The figure shows the supply and demand curves of a firm. 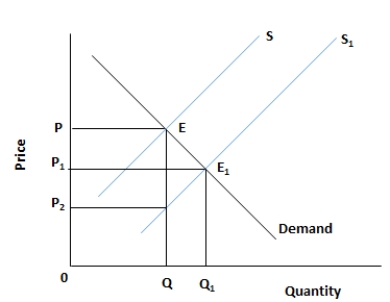
-Which of the following is a possible cause of an increase in the demand for health care?
A) A young population
B) A fall in the purchasing power of households
C) An aging population
D) A fall in the total population of a country
E) Technological advancement
Correct Answer:

Verified
Correct Answer:
Verified
Q10: Figure 5.1. The figure shows a linear
Q11: Figure 5.3. The figure shows the wage
Q12: Figure 5.1. The figure shows a linear
Q13: Figure 5.2. The figure shows the supply
Q14: Figure 5.1. The figure shows a linear
Q16: Figure 5.3. The figure shows the wage
Q17: Figure 5.2. The figure shows the supply
Q18: Figure 5.3. The figure shows the wage
Q19: Figure 5.3. The figure shows the wage
Q20: Scenario 4-1<br>In a given year, country A