Multiple Choice
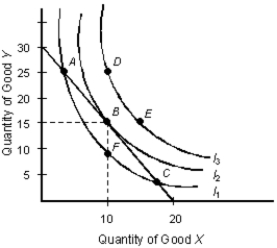
The below figure shows the various combinations of the goods X and Y that yield different levels of utility.Figure 7.3

-In Figure 7.3, if the price of one unit of good X and one unit of good Y is $30 and $20, respectively, the consumer's income is _____.
A) $50
B) $150
C) $400
D) $600
E) $900
Correct Answer:

Verified
Correct Answer:
Verified
Q42: The table below shows the total utility
Q43: The below table shows the average utility
Q44: The below indifference map shows the various
Q45: The table given below depicts the total
Q46: The below table shows the average utility
Q48: The below table shows the average utility
Q49: The table given below reports the total
Q50: The below figure shows the various combinations
Q51: The below figure shows the various combinations
Q52: The table given below reports the total