True/False
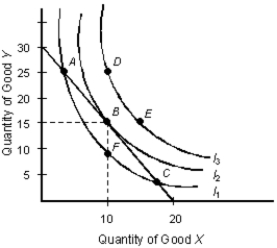
The below figure shows the various combinations of the goods X and Y that yield different levels of utility.Figure 7.3

-A consumer is in equilibrium when the slope of his or her indifference curve is equal to his or her budget constraint.
Correct Answer:

Verified
Correct Answer:
Verified
Related Questions
Q46: The below table shows the average utility
Q47: The below figure shows the various combinations
Q48: The below table shows the average utility
Q49: The table given below reports the total
Q50: The below figure shows the various combinations
Q52: The table given below reports the total
Q53: The below table shows the average utility
Q54: The table given below depicts the total
Q55: The below figure shows the various combinations
Q56: The below indifference map shows the various