True/False
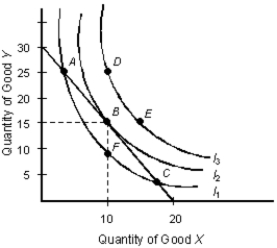
The below figure shows the various combinations of the goods X and Y that yield different levels of utility.Figure 7.3

-If cherries cost twice as much as dates, and the last cherry consumed provides twice as much utility as the last date consumed, the consumer is maximizing utility.
Correct Answer:

Verified
Correct Answer:
Verified
Q57: The table below shows the total utility
Q58: The table given below depicts the total
Q59: The below indifference map shows the various
Q60: The below table shows the average utility
Q61: The table below shows the total utility
Q63: The below figure shows the various combinations
Q64: The table given below depicts the total
Q65: The table below shows the total utility
Q66: The below figure shows the various combinations
Q67: The table given below depicts the total