Multiple Choice
The below indifference map shows the various combinations of hours of music and apples that yield different levels of utility.Figure 7.1
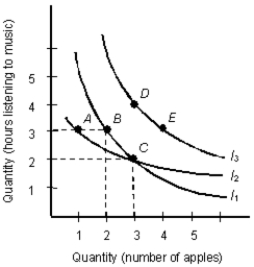
-According to Figure 7.1, which of the following is incorrect?
A) The consumer prefers B to A
B) The consumer is not indifferent between A and B
C) The consumer is indifferent between D and E
D) Indifference curve I2 should cross indifference curve I1 as shown
E) The consumer is indifferent between B and C
Correct Answer:

Verified
Correct Answer:
Verified
Q54: The table given below depicts the total
Q55: The below figure shows the various combinations
Q56: The below indifference map shows the various
Q57: The table below shows the total utility
Q58: The table given below depicts the total
Q60: The below table shows the average utility
Q61: The table below shows the total utility
Q62: The below figure shows the various combinations
Q63: The below figure shows the various combinations
Q64: The table given below depicts the total