Multiple Choice
The following graph shows the demand and cost curves of an imperfectly competitive firm. MC and ATC represent the marginal cost curve and the average cost curve respectively.Figure 9.1
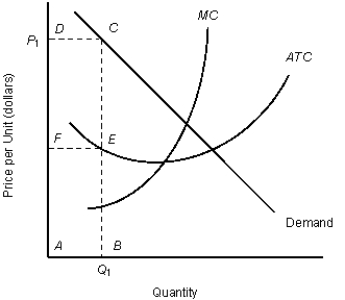
-Refer to Figure 9.1. At price P1 , the firm sells quantity Q1, and total cost is shown by:
A) the rectangle ABCD.
B) the rectangle ABEF.
C) the rectangle FECD.
D) the distance AB.
E) the distance BC.
Correct Answer:

Verified
Correct Answer:
Verified
Q23: The following figure shows the cost and
Q24: The table given below reports the marginal
Q25: The figure given below shows the revenue
Q26: Scenario 9.1<br>Jane left her job at Siemens
Q27: Scenario 9.2<br>Consider a publicly held firm (one
Q29: The figure given below shows the revenue
Q30: Scenario 9.2<br>Consider a publicly held firm (one
Q31: The figure given below shows three Short
Q32: Scenario 9.2<br>Consider a publicly held firm (one
Q33: The figure given below shows the revenue