Multiple Choice
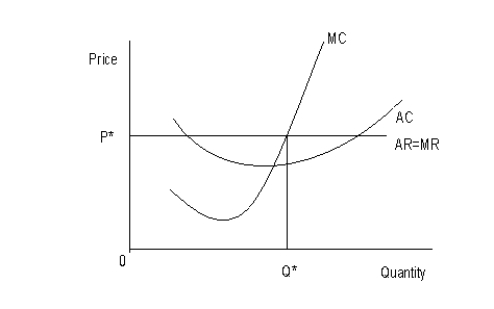
The following figure shows the cost and revenue structures of a firm. MC represents the marginal cost curve, AC represents the average cost curve, AR represents the average revenue curve, and MR represents the marginal revenue curve. P* is the equilibrium price and Q* is the equilibrium output.Figure 9.5
-A firm's accounting profit does not include its:
A) explicit costs.
B) sunk costs.
C) fixed costs.
D) opportunity costs.
E) variable costs.
Correct Answer:

Verified
Correct Answer:
Verified
Q18: The table given below reports the marginal
Q19: Scenario 9.2<br>Consider a publicly held firm (one
Q20: The figure given below shows the revenue
Q21: Scenario 9.2<br>Consider a publicly held firm (one
Q22: The table given below shows the total
Q24: The table given below reports the marginal
Q25: The figure given below shows the revenue
Q26: Scenario 9.1<br>Jane left her job at Siemens
Q27: Scenario 9.2<br>Consider a publicly held firm (one
Q28: The following graph shows the demand and