Multiple Choice
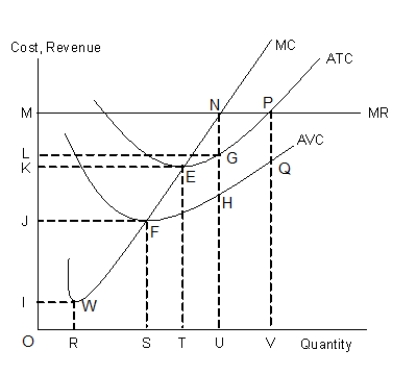
The figure given below shows the revenue and cost curves of a perfectly competitive firm.Figure 10.1
-A perfectly competitive firm produces 50 units of output, at equilibrium, in the short run. The total cost borne by the firm is $300 and the average revenue is $2. Therefore, the firm:
A) is just breaking even.
B) is earning positive profits.
C) is facing a positively sloped demand curve.
D) is suffering losses.
E) is experiencing diseconomies of scale.
Correct Answer:

Verified
Correct Answer:
Verified
Q3: The figure given below shows the aggregate
Q4: The figure given below shows the aggregate
Q5: The figure given below shows the revenue
Q6: The figure given below shows the revenue
Q7: Scenario 9.2<br>Consider a publicly held firm (one
Q9: The figure given below shows the revenue
Q10: The figure given below shows the aggregate
Q11: The figure given below shows the aggregate
Q12: Scenario 9.2<br>Consider a publicly held firm (one
Q13: The figure given below shows the revenue