Multiple Choice
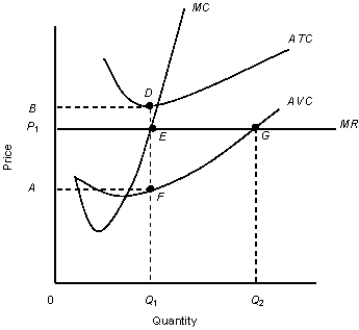
The figure given below shows the revenue and cost curves of a perfectly competitive firm.Figure 10.5
 MC: Marginal cost curve
MR: Marginal revenue curve.ATC: Average-total-cost curve
AVC: Average-variable-cost curve
-Assume the price facing the firm in Figure 10.5 is P1.Which of the following statements is true?
A) Total revenue for the firm is area 0BDQ1.
B) The firm should produce Q2.
C) Total cost for the firm is area 0P1EQ1.
D) The firm's total revenue is more than sufficient to cover its variable costs, so it should remain in operation.
E) The firm should shut down because price per unit received is less than average total cost.
Correct Answer:

Verified
Correct Answer:
Verified
Q1: The figure given below shows the revenue
Q2: The figure given below shows the revenue
Q3: The figure given below shows the aggregate
Q4: The figure given below shows the aggregate
Q5: The figure given below shows the revenue
Q7: Scenario 9.2<br>Consider a publicly held firm (one
Q8: The figure given below shows the revenue
Q9: The figure given below shows the revenue
Q10: The figure given below shows the aggregate
Q11: The figure given below shows the aggregate