Multiple Choice
The figure given below shows the revenue and cost curves of a perfectly competitive firm.Figure 10.1
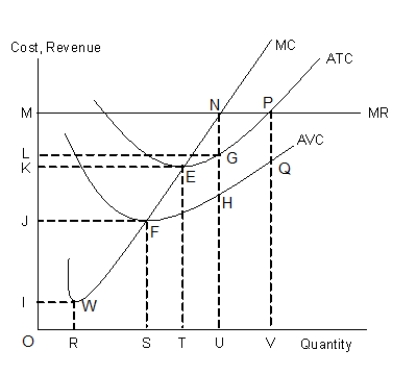
-Suppose that in a perfectly competitive market, the market supply of a good increases. As a result, the individual firm's:
A) supply curve would shift outward and the firm would increase output.
B) supply curve would shift inward and the firm would decrease output.
C) average-total-cost curve would shift upward and the firm would increase output.
D) marginal-revenue curve would shift upward and the firm would increase output.
E) marginal-revenue curve would shift downward and the firm would decrease output.
Correct Answer:

Verified
Correct Answer:
Verified
Q66: The figure given below shows the aggregate
Q67: Scenario 9.2<br>Consider a publicly held firm (one
Q68: Scenario 9.2<br>Consider a publicly held firm (one
Q69: The figure given below shows the aggregate
Q70: The figure given below shows the aggregate
Q72: The figure given below shows the revenue
Q73: The figure given below shows the aggregate
Q74: The figure given below shows the revenue
Q75: The figure given below shows the aggregate
Q76: The figure given below shows the aggregate