Multiple Choice
The figure given below shows the revenue and cost curves of a perfectly competitive firm.Figure 10.2
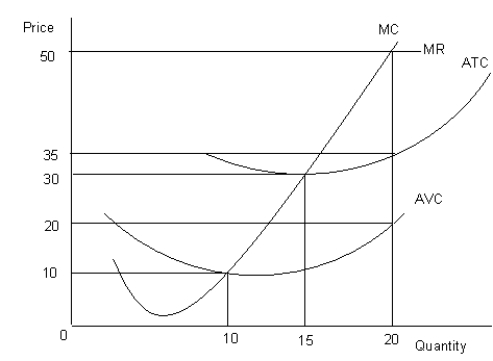 MC: Marginal cost curve
MR: Marginal revenue curve
ATC: Average-total-cost curve
AVC: Average-variable-cost curve
-Refer to Figure 10.2. What is the firm's total fixed cost at the profit-maximizing output level?
A) $400
B) $300
C) $600
D) $450
E) $500
Correct Answer:

Verified
Correct Answer:
Verified
Q67: Scenario 9.2<br>Consider a publicly held firm (one
Q68: Scenario 9.2<br>Consider a publicly held firm (one
Q69: The figure given below shows the aggregate
Q70: The figure given below shows the aggregate
Q71: The figure given below shows the revenue
Q73: The figure given below shows the aggregate
Q74: The figure given below shows the revenue
Q75: The figure given below shows the aggregate
Q76: The figure given below shows the aggregate
Q77: The figure given below shows the revenue