Multiple Choice
The figure given below shows the revenue and cost curves of a perfectly competitive firm.Figure 10.1
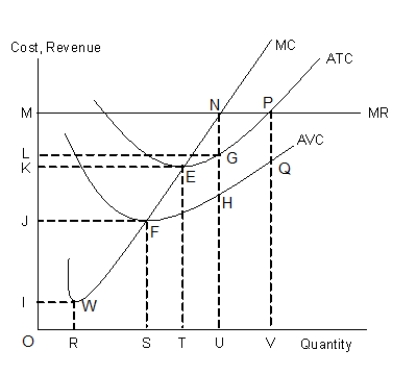
-A firm whose price is below its average cost:
A) is earning negative economic profit.
B) is earning positive economic profit.
C) is just breaking even.
D) is earning zero economic profit.
E) is earning zero accounting profit.
Correct Answer:

Verified
Correct Answer:
Verified
Q100: The table given below shows the price
Q101: The figure given below shows the aggregate
Q102: The figure given below shows the aggregate
Q103: The following figure shows equilibrium at the
Q104: The figure given below shows the demand
Q106: The figure given below shows the revenue
Q107: The figure given below shows the revenue
Q108: The figure given below shows the aggregate
Q109: Scenario 9.2<br>Consider a publicly held firm (one
Q110: The figure given below shows the revenue