Multiple Choice
The figure given below shows the revenue and the cost curves of a perfectly competitive firm.Figure 10.3
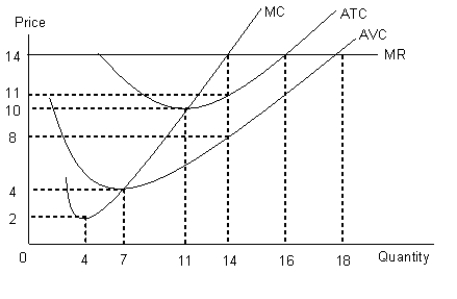
-Refer to Figure 10.3 and calculate the total fixed cost borne by the firm at the profit maximizing level of the output.
A) $28
B) $84
C) $70
D) $56
E) $42
Correct Answer:

Verified
Correct Answer:
Verified
Q105: The figure given below shows the revenue
Q106: The figure given below shows the revenue
Q107: The figure given below shows the revenue
Q108: The figure given below shows the aggregate
Q109: Scenario 9.2<br>Consider a publicly held firm (one
Q111: The following figure shows equilibrium at the
Q112: Scenario 9.2<br>Consider a publicly held firm (one
Q113: The table given below shows the total
Q114: The figure given below shows the aggregate
Q115: The table given below shows the price