Multiple Choice
The figure given below shows the revenue and cost curves of a perfectly competitive firm.Figure 10.2
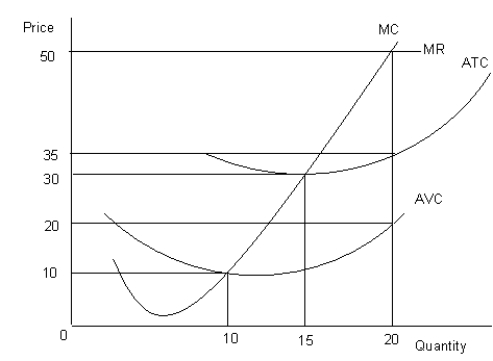 MC: Marginal cost curve
MR: Marginal revenue curve
ATC: Average-total-cost curve
AVC: Average-variable-cost curve
-The minimum point of the _____ curve is called the shutdown price.
A) average-fixed-cost
B) marginal cost
C) average -total-cost
D) total fixed cost
E) average-variable-cost
Correct Answer:

Verified
Correct Answer:
Verified
Q38: The figure given below shows the revenue
Q39: The figure given below shows the aggregate
Q40: The figure given below shows the revenue
Q41: The following figure shows equilibrium at the
Q42: The following figure shows equilibrium at the
Q44: The figure given below shows the demand
Q45: The following figure shows equilibrium at the
Q46: The figure given below shows the revenue
Q47: The figure given below shows the revenue
Q48: Scenario 9.2<br>Consider a publicly held firm (one