Multiple Choice
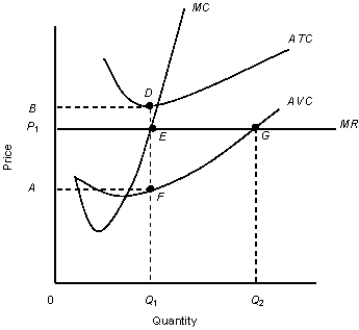
The figure given below shows the revenue and cost curves of a perfectly competitive firm.Figure 10.5
 MC: Marginal cost curve
MR: Marginal revenue curve.ATC: Average-total-cost curve
AVC: Average-variable-cost curve
-If a profit-maximizing, perfectly competitive firm is making only a normal profit in the short run, then the firm is in:
A) disequilibrium.
B) equilibrium where MR exceeds minimum ATC.
C) equilibrium where MR equals minimum AVC.
D) equilibrium where P = AFC.
E) equilibrium where P = ATC
Correct Answer:

Verified
Correct Answer:
Verified
Q35: The figure given below shows the aggregate
Q36: The figure given below shows the revenue
Q37: The figure given below shows the revenue
Q38: The figure given below shows the revenue
Q39: The figure given below shows the aggregate
Q41: The following figure shows equilibrium at the
Q42: The following figure shows equilibrium at the
Q43: The figure given below shows the revenue
Q44: The figure given below shows the demand
Q45: The following figure shows equilibrium at the