Multiple Choice
The figure given below shows the revenue and the cost curves of a perfectly competitive firm.Figure 10.3
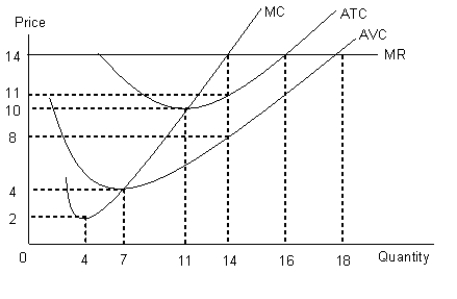
-Refer to Figure 10.3 and identify the price level at which the firm earns normal profit.
A) $4
B) $8
C) $10
D) $2
E) $14
Correct Answer:

Verified
Correct Answer:
Verified
Related Questions
Q24: The following figure shows equilibrium at the
Q25: The figure given below shows the revenue
Q26: The figure given below shows the aggregate
Q27: The following figure shows equilibrium at the
Q28: The figure given below shows the aggregate
Q30: The table given below shows the total
Q31: The table given below shows the total
Q32: The figure given below shows the revenue
Q33: Scenario 9.2<br>Consider a publicly held firm (one
Q34: The figure given below shows the aggregate