Multiple Choice
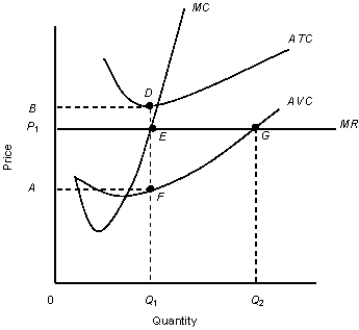
The figure given below shows the revenue and cost curves of a perfectly competitive firm.Figure 10.5
 MC: Marginal cost curve
MR: Marginal revenue curve.ATC: Average-total-cost curve
AVC: Average-variable-cost curve
-According to Figure 10.5, the firm has:
A) profits equal to the area AP1EF.
B) profits equal to the area P1BDE.
C) losses equal to the area 0AFQ1.
D) losses equal to the area P1BDE.
E) no profit no loss.
Correct Answer:

Verified
Correct Answer:
Verified
Q20: The figure given below shows the aggregate
Q21: The figure given below shows the demand
Q22: The figure given below shows the revenue
Q23: The figure given below shows the aggregate
Q24: The following figure shows equilibrium at the
Q26: The figure given below shows the aggregate
Q27: The following figure shows equilibrium at the
Q28: The figure given below shows the aggregate
Q29: The figure given below shows the revenue
Q30: The table given below shows the total