Multiple Choice
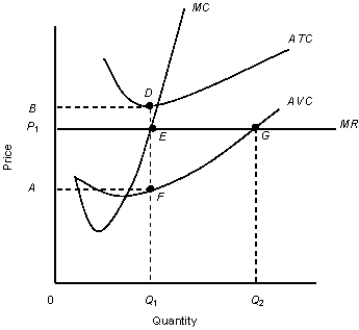
The figure given below shows the revenue and cost curves of a perfectly competitive firm.Figure 10.5
 MC: Marginal cost curve
MR: Marginal revenue curve.ATC: Average-total-cost curve
AVC: Average-variable-cost curve
-For a perfectly competitive firm, in the short run, which of the following statements is true?
A) A price above minimum average variable cost, but below average total cost will produce an economic profit.
B) A price below minimum average variable cost will cause the firm to shut down.
C) Marginal cost is parallel to the axis showing quantity of output.
D) Price is always greater than marginal revenue.
E) Every firm contributes a significant amount to the total market output.
Correct Answer:

Verified
Correct Answer:
Verified
Q60: The figure given below shows the revenue
Q61: Scenario 9.2<br>Consider a publicly held firm (one
Q62: Scenario 9.2<br>Consider a publicly held firm (one
Q63: The figure given below shows the revenue
Q64: The figure given below shows the aggregate
Q66: The figure given below shows the aggregate
Q67: Scenario 9.2<br>Consider a publicly held firm (one
Q68: Scenario 9.2<br>Consider a publicly held firm (one
Q69: The figure given below shows the aggregate
Q70: The figure given below shows the aggregate