Multiple Choice
The figure given below shows the revenue and cost curves of a perfectly competitive firm.Figure 10.2
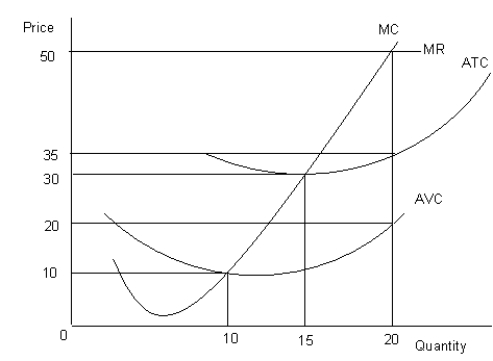 MC: Marginal cost curve
MR: Marginal revenue curve
ATC: Average-total-cost curve
AVC: Average-variable-cost curve
-Refer to Figure 10.2. If the market price falls to $10, the firm would produce:
A) nothing.
B) 15 units.
C) 5 units.
D) 10 units.
E) 20 units.
Correct Answer:

Verified
Correct Answer:
Verified
Q58: The table given below shows the price
Q59: The figure given below shows the revenue
Q60: The figure given below shows the revenue
Q61: Scenario 9.2<br>Consider a publicly held firm (one
Q62: Scenario 9.2<br>Consider a publicly held firm (one
Q64: The figure given below shows the aggregate
Q65: The figure given below shows the revenue
Q66: The figure given below shows the aggregate
Q67: Scenario 9.2<br>Consider a publicly held firm (one
Q68: Scenario 9.2<br>Consider a publicly held firm (one