Multiple Choice
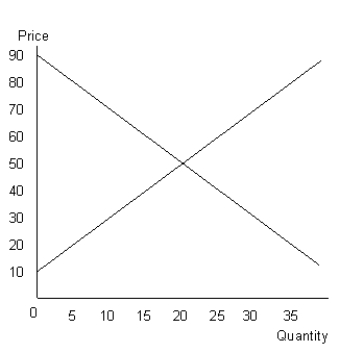
The figure given below shows the aggregate demand and supply curves of a perfectly competitive market.Figure 10.7

-When long-run average costs are declining for the entire range of demand, the firm is known as a(n) :
A) local monopoly.
B) regulated monopoly.
C) monopolistically competitive firm.
D) natural monopoly.
E) oligopoly.
Correct Answer:

Verified
Correct Answer:
Verified
Q67: The figure given below shows the cost
Q68: The figure given below shows the cost
Q69: The table given below shows the price,
Q70: The figures given below represent the revenue
Q71: The figure given below shows the cost
Q73: The figure given below shows the aggregate
Q74: The figure given below shows the demand
Q75: The figure given below shows the cost
Q76: The figure given below shows the cost
Q77: The figure given below shows the cost