Multiple Choice
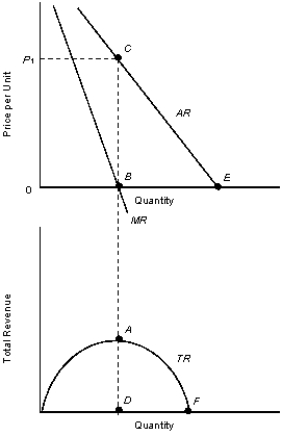
The figures given below represent the revenue curves of a monopolist.Figure 11.2
 TR: Total revenue curve
AR: Average revenue curve
MR: Marginal revenue curve
-Refer to Figure 11.2. In order to maximize profits, what quantity should the monopolist produce?
A) B
B) E
C) Between B and E
D) Impossible to determine because we are not given the cost curves.
E) Impossible to determine because we are not given the demand curve.
Correct Answer:

Verified
Correct Answer:
Verified
Q65: The following figure shows the revenue curves
Q66: The table given below shows the price,
Q67: The figure given below shows the cost
Q68: The figure given below shows the cost
Q69: The table given below shows the price,
Q71: The figure given below shows the cost
Q72: The figure given below shows the aggregate
Q73: The figure given below shows the aggregate
Q74: The figure given below shows the demand
Q75: The figure given below shows the cost