Multiple Choice
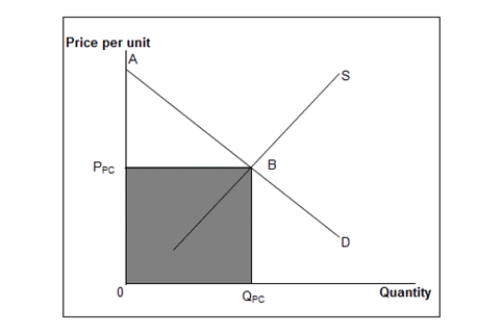
The figure below shows the market equilibrium (point B) at the intersection of demand and supply curves under perfect competition.Figure 11.5
 D: Market demand curve
S: Market supply curve
-Refer to Figure 11.5. Assume that the curve labeled S represents the monopolist's marginal-cost curve and the curve labeled D represents the monopolist's demand curve. Which of the following will represent the consumer surplus?
A) The area PPCBA
B) The area 0BPPC
C) The area 0BA
D) An area that is less than PPCBA
E) The area ABS
Correct Answer:

Verified
Correct Answer:
Verified
Q31: The following table shows the marginal revenues
Q32: The following figure shows revenue and cost
Q33: The following figure shows revenue and cost
Q34: The following table shows the units of
Q35: The figure given below shows the cost
Q37: The figures given below represent the revenue
Q38: The table given below shows the price,
Q39: The table given below shows the price,
Q40: The figure given below shows the cost
Q41: The figure given below shows the cost