Multiple Choice
The following figure shows revenue and cost curves of a monopolist.Figure 11.8
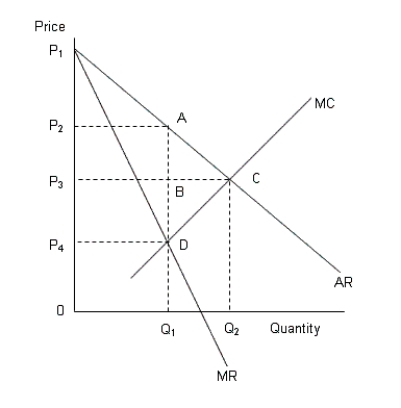 AR: Average revenue curve
MR: Marginal revenue curve
MC: Marginal cost curve
-According to Figure 11.8, the profit maximizing price of the monopolist is:
A) 0.
B) P4.
C) P3.
D) P2.
E) P1.
Correct Answer:

Verified
Correct Answer:
Verified
Related Questions
Q28: The figure given below shows the cost
Q29: The figure given below shows the aggregate
Q30: The table given below shows the price,
Q31: The following table shows the marginal revenues
Q32: The following figure shows revenue and cost
Q34: The following table shows the units of
Q35: The figure given below shows the cost
Q36: The figure below shows the market equilibrium
Q37: The figures given below represent the revenue
Q38: The table given below shows the price,