Multiple Choice
The following figures show the demand and cost curves of a perfectly competitive firm and a monopoly respectively.Figure 11.7
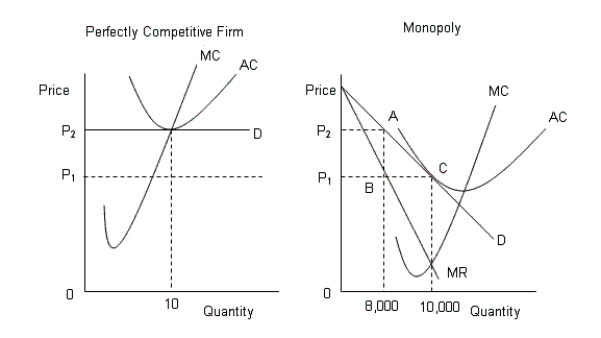 D: Average Revenue
AC: Average cost
MC: Marginal cost
MR: Marginal cost
-Refer to Figure 11.7. At the profit maximizing level of output, the monopolist will:
A) earn economic profit.
B) earn super-normal profit.
C) charge a price equal to the marginal cost of production.
D) charge a price lower than the price charged by a perfectly competitive firm.
E) zero profit.
Correct Answer:

Verified
Correct Answer:
Verified
Q84: The figure given below shows the cost
Q85: The figure given below shows the aggregate
Q86: The figure given below shows the aggregate
Q87: The figure given below shows the aggregate
Q88: The figure given below shows the cost
Q90: The following figure shows revenue and cost
Q91: The table given below shows the prices
Q92: The figure given below shows the aggregate
Q93: The table given below shows the prices
Q94: The figure given below shows the cost