Multiple Choice
The following figure shows revenue and cost curves of a monopolist.Figure 11.8
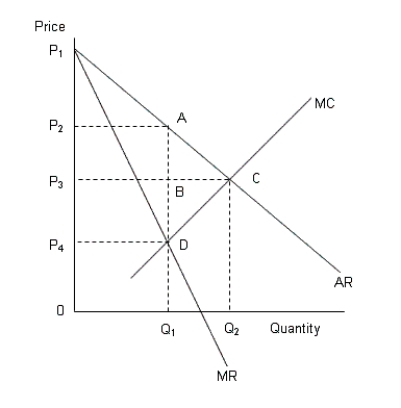 AR: Average revenue curve
MR: Marginal revenue curve
MC: Marginal cost curve
-According to Figure 11.8, the deadweight loss of monopoly is:
A) the area ABC.
B) the area BCD.
C) the area ACD.
D) the area P3P2AC.
E) the area P3P4DC.
Correct Answer:

Verified
Correct Answer:
Verified
Q85: The figure given below shows the aggregate
Q86: The figure given below shows the aggregate
Q87: The figure given below shows the aggregate
Q88: The figure given below shows the cost
Q89: The following figures show the demand and
Q91: The table given below shows the prices
Q92: The figure given below shows the aggregate
Q93: The table given below shows the prices
Q94: The figure given below shows the cost
Q95: The figure given below shows the cost