Multiple Choice
The figure given below shows revenue and cost curves of a monopolistically competitive firm.Figure: 12.1
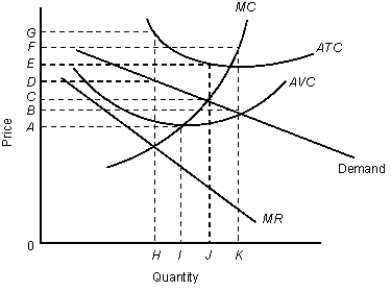 In the figure,
MR: Marginal revenue curve
ATC: Average total cost curve
AVC: Average variable cost curve
MC: Marginal cost curve
-A firm under monopolistic competition reaches equilibrium in the short run at a point where:
A) price equals average variable cost.
B) marginal revenue equals rising marginal cost.
C) price equals marginal cost.
D) marginal revenue equals average revenue.
E) the firm's marginal-cost curve intersects its marginal-revenue curve from above.
Correct Answer:

Verified
Correct Answer:
Verified
Q40: The following table shows the payoff matrix
Q41: The table below shows the payoff (profit)
Q42: The table below shows the payoff (profit)
Q43: The figure given below shows the revenue
Q44: The following table shows the payoff matrix
Q46: The figure given below shows the revenue
Q47: The table below shows the payoff (profit)
Q48: The table below shows the payoff (profit)
Q49: The table below shows the payoff (profit)
Q50: The figure given below shows the revenue