Multiple Choice
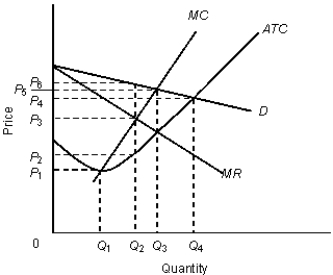
The figure given below shows the revenue and cost curves of a monopolistically competitive firm.Figure: 12.3
 In the figure,
D: Demand curve
MR: Marginal revenue curve
MC: Marginal cost curve
ATC: Average total cost curve
-The profit per unit of output for the firm in the Figure 12.3 is:
A) P5 - P3.
B) P6 - P3.
C) P3 - P2.
D) P6 - P2.
E) P4 - P2.
Correct Answer:

Verified
Correct Answer:
Verified
Q45: The figure given below shows revenue and
Q46: The figure given below shows the revenue
Q47: The table below shows the payoff (profit)
Q48: The table below shows the payoff (profit)
Q49: The table below shows the payoff (profit)
Q51: The following table shows the payoff matrix
Q52: The following table shows the payoff matrix
Q53: The table below shows the payoff (profit)
Q54: The figure given below shows the revenue
Q55: The table below shows the payoff (profit)