Multiple Choice
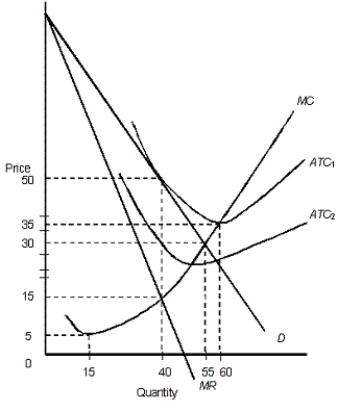
The figure below shows the revenue and cost curves of a monopolistically competitive firm.Figure: 12.2
 In the figure,
D: Demand curve
MR: Marginal revenue curve
ATC1 and ATC2: Average total cost curves
MC: Marginal cost curve
-In Figure 12.2, assume that the average total cost of the firm is represented by the curve ATC2. In the long run, we would expect:
A) entry of firms into the market because economic profits exist.
B) exit of firms from the market because the existing firms suffer economic losses.
C) each firm's demand curve to shift to the right.
D) the market to become perfectly competitive.
E) the market to become a monopoly.
Correct Answer:

Verified
Correct Answer:
Verified
Q3: The table below shows the payoff (profit)
Q4: The table below shows the payoff (profit)
Q5: The table below shows the payoff (profit)
Q6: The table below shows the payoff (profit)
Q7: The figure given below shows the cost
Q9: The figure given below shows the revenue
Q10: The table below shows the payoff (profit)
Q11: The table below shows the payoff (profit)
Q12: The figure given below shows the revenue
Q13: The figure given below shows the revenue