True/False
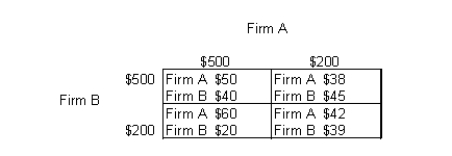
The table below shows the payoff (profit) matrix of Firm A and Firm B indicating the profit outcome that corresponds to each firm's pricing strategy (where $500 and $200 are the pricing strategies of two firms).Table 12.2

-Oligopolies can arise as a result of both natural barriers and government created barriers.
Correct Answer:

Verified
Correct Answer:
Verified
Q1: The figure given below shows the revenue
Q2: The following table shows the payoff matrix
Q4: The table below shows the payoff (profit)
Q5: The table below shows the payoff (profit)
Q6: The table below shows the payoff (profit)
Q7: The figure given below shows the cost
Q8: The figure below shows the revenue and
Q9: The figure given below shows the revenue
Q10: The table below shows the payoff (profit)
Q11: The table below shows the payoff (profit)