Multiple Choice
The figure below shows the revenue and cost curves of a monopolistically competitive firm.Figure: 12.2
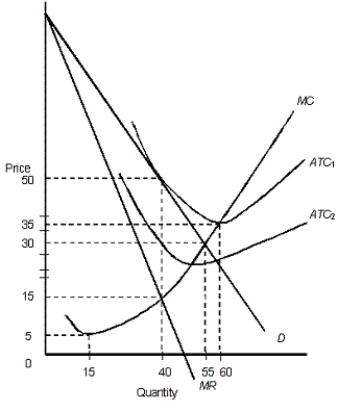 In the figure,
D: Demand curve
MR: Marginal revenue curve
ATC1 and ATC2: Average total cost curves
MC: Marginal cost curve
-In Figure 12.2, if the market is monopolistically competitive, which quantity represents long-run equilibrium for the firm?
A) 15
B) Between 15 and 40
C) 40
D) 55
E) 60
Correct Answer:

Verified
Correct Answer:
Verified
Q104: The figure given below shows the revenue
Q105: The table below shows the payoff (profit)
Q106: The figure given below shows the revenue
Q107: The figure given below shows the revenue
Q108: The table below shows the payoff (profit)
Q110: The following table shows the payoff matrix
Q111: The table below shows the payoff (profit)
Q112: The table below shows the payoff (profit)
Q113: The figure given below shows the revenue
Q114: The figure given below shows the revenue