Multiple Choice
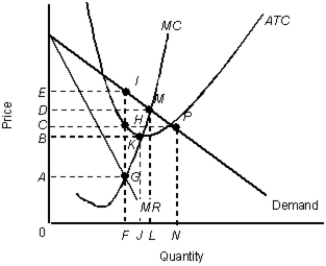
The figure given below shows the revenue and cost curves of a monopolistically competitive firm.Figure 12.4
 MR: Marginal revenue curve
ATC: Average total cost curve
MC: Marginal cost curve
-The oligopoly market structure model is characterized by:
A) many firms in an industry producing differentiated products.
B) many firms in an industry producing identical products.
C) few firms in an industry with natural barriers to entry.
D) a single firm in an industry with barriers to entry.
E) many firms in an industry with barriers to entry.
Correct Answer:

Verified
Correct Answer:
Verified
Q104: The figure given below shows the revenue
Q105: The table below shows the payoff (profit)
Q106: The figure given below shows the revenue
Q107: The figure given below shows the revenue
Q108: The table below shows the payoff (profit)
Q109: The figure below shows the revenue and
Q110: The following table shows the payoff matrix
Q111: The table below shows the payoff (profit)
Q112: The table below shows the payoff (profit)
Q114: The figure given below shows the revenue